
Comparing median home price changes to the inflation rate reveals that home values and inflation grow at different rates. A graph illustrating over 70 years of this trend makes this distinction clear.
This insight can boost an investment strategy, which I’ve detailed in this week’s one-page special housing update.
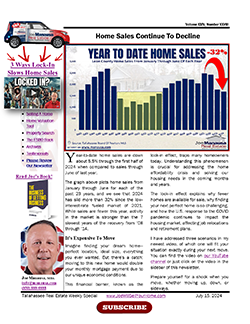
Year-to-date home sales are down about 5.5% through the first half of 2024 compared to sales through June last year.
The graph in this week’s one-page special housing update plots home sales from January through June for each of the past 23 years. We see that 2024 has slid more than 32% since the low-interest-rate-fueled market of 2021.
So, what’s causing this slide? How will it impact you? Find out in this week’s one-page special housing report.
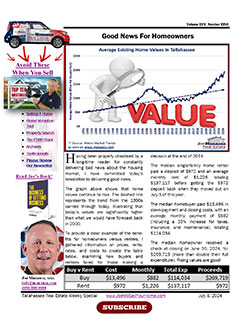
Having been properly chastised by a long-time reader for constantly delivering bad news about the housing market, I have committed today’s newsletter to delivering good news.
The graph in this week’s one-page special housing report shows that home values continue to rise, resulting in record returns for homeowners. Check out this week’s newsletter to see why sellers are smiling today.
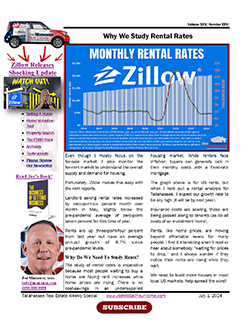
Even though I mostly focus on the for-sale market, I also monitor the for-rent market to understand the overall supply and demand for housing. Fortunately, Zillow makes this easy with the rent reports.
This week’s study of rental rates is imperative because most people waiting to buy a home face rent increases while home prices rise. There are no cost-savings in an undersupplied housing market, here’s what’s happening with rents.
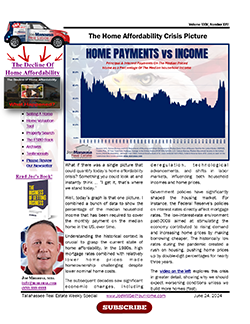
What if there was a single picture that could quantify today’s home affordability crisis?
This week’s graph does just that. It combines data to show the percentage of median household income needed to cover the monthly payment on a median home in the US over time.
- e-Book
- inflation
- Other
- Real Estate Supply And Demand
- Tallahassee Life! e-Newsletter
- Tallahassee Real Estate Newsletter
- Weekly Special Real Estate Report