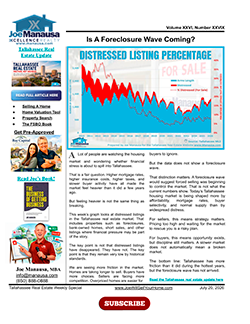
Foreclosure headlines are back, but the local numbers tell a more useful story.
This week’s report looks at distressed listings in Tallahassee and what they reveal about buyer leverage, seller pressure, and real market risk. You’ll see whether today’s slower housing market is showing early warning signs or simply returning to more normal conditions.
Download the report before making your next move in the Tallahassee real estate market.
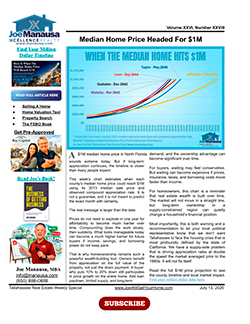
A $1M median home price sounds impossible, until you see the math.
This week’s report shows when North Florida counties could reach that mark if long-term appreciation continues.
The dates are not the real shock.
The real shock is how quietly compounding can make today’s affordability problem much worse.
Download this week’s edition to see which counties are moving fastest and what it means for buyers, sellers, and homeowners.
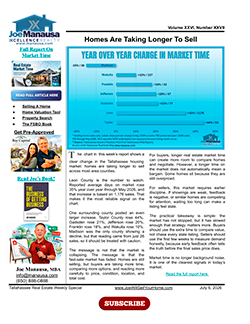
Tallahassee homes are taking longer to sell, and this week’s newsletter shows where the slowdown is most visible.
The report compares year-over-year changes in market time by county, including Leon County’s 35% increase through May 2026.
Download the newsletter to see why the fast-sale market has faded, how other counties are faring, and which county actually showed improvement in our report.
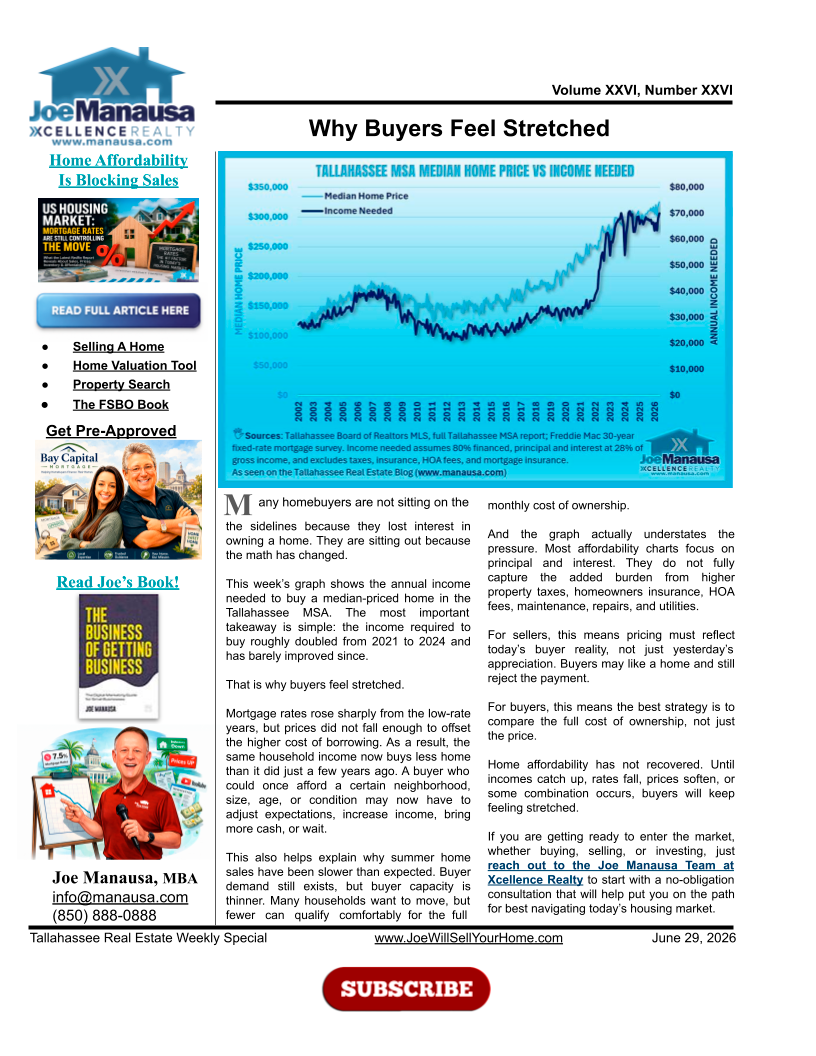
Many Tallahassee buyers still want to move, but the income needed to buy has changed dramatically.
This week’s market update shows why the typical buyer feels stretched, even when motivation remains strong. The graph explains how higher payments, record prices, and rising ownership costs are limiting what buyers can afford today.
Read the full update to see how this affordability squeeze is shaping the local market.
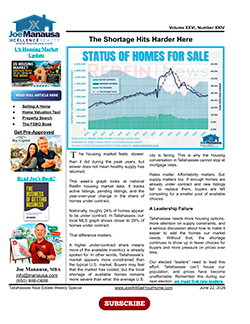
This week’s report compares the national housing market with what we are seeing in Tallahassee.
It looks at active listings, pending listings, and the share of homes already under contract to show how supply pressure differs from one market to another.
How does Tallahassee compare with the US?, and what does that say about whether local leadership is making housing enough of a priority?
- e-Book
- inflation
- Other
- Real Estate Supply And Demand
- Tallahassee Life! e-Newsletter
- Tallahassee Real Estate Newsletter
- us housing market
- Weekly Special Real Estate Report